GENERAL INFORMATION
• Chordomas were first described by Virshow in 1957 and named as Chordoma by Ribbert in the 1890s.
• Slow growing malignant primary bone tumor
• Originates from residual of undifferentiated notochordal remnants in nucleus pulposus of spine
• Within axial skeleton
• Most commonly occurs along caudal and cranial extremes of embryonic notochord (upper and lower ends of the spine)
• 1 to 4% of malignant osseous tumors
• Chordoma is 4th most frequent primary malignant tumor
• Most patients are 40 to 70 years of age
• Physaliferous cell is the most representative cell present in this tumor
• Most common in sacrococcygeal and sphenooccipital region
• Occurs along central axis of sacrum and spine
• 20% have calcifications
CLINICAL DATA
• Rare; 1-4% of all bone malignancies
•
Incidence; 0.08 per 100.000
•
Very low incidence in patients younger than 40 years old
•
< 5% of all chordomas present in children.
•
Male predilection (2:1)
•
Localization
• Skull base (32%)
• Mobile spine (32.8%)
• Sacrum (29.2%). Chordoma is the most frequent tumor in the sacrum.
Differential diagnosis
• Mets
• Myeloma
• Lymphoma
• Giant Cell Tumor (GCT)
• Clear cell chondrosarcoma
• Chondrosarcoma
CLINICAL PRESENTATION
Signs/Symptoms
• Indolent and slow growing mass
• Relative to tumor location; May cause constipation
• Spheno-occipital
• Headache, cranial nerve palsies; 25% of patients have intracranial mass, endocrinopathy can occur
• Mobile spine and Sacrococcygeal
• Deep back pain, radiculopathy, bowel or bladder dysfunction
Prevalence
• Male > Female 2:1
Age
• 5th – 7th decade most commonly
• Rear in patients younger than 40 years old
Sites
• Localization
• Skull base (32%)
• Mobile spine (32.8%)
• Sacrum (29.2%). Most chordomas in the sacrum involve 4th and 5th sacral vertebrae.
RADIOGRAPHIC PRESENTATION
• Presents as a central lytic lesion in the axial skeleton
• Chordomas expand and destroy bone
• May erode clivus, sella turca, petrous, and sphenoid bones
• Lesions can be overlooked on plain x-rays, and CT scans and MRI often do not extend below S2
• Commonly extends into soft tissue
Plain x-ray (Fig. 1-3)
• Midline bone lytic lesion with focus in the vertebral body
• Surrounding soft tissue mass
• Invade intervertebral discs and contiguous vertebras.
MRI (Fig. 4-10)
• Destructive bone lesion
• Isointense or hypointense on T1W (Fig. 4-5)
• Hyperintense on T2W (Fig. 8 & 9)
• Hyper enhancement with gadolinium (Fig. 6 & 7).
CT (Fig. 11 & 12)
• Destructive bone lesion
•
Cortical destruction
•
Soft tissue mass is easily detected on a CT scan
•
20% of patients with chordomas shows calcifications
•
Subtle calcification are easily detected with CT scan
Bone scan
• Reduced or normal uptake of radioisotope
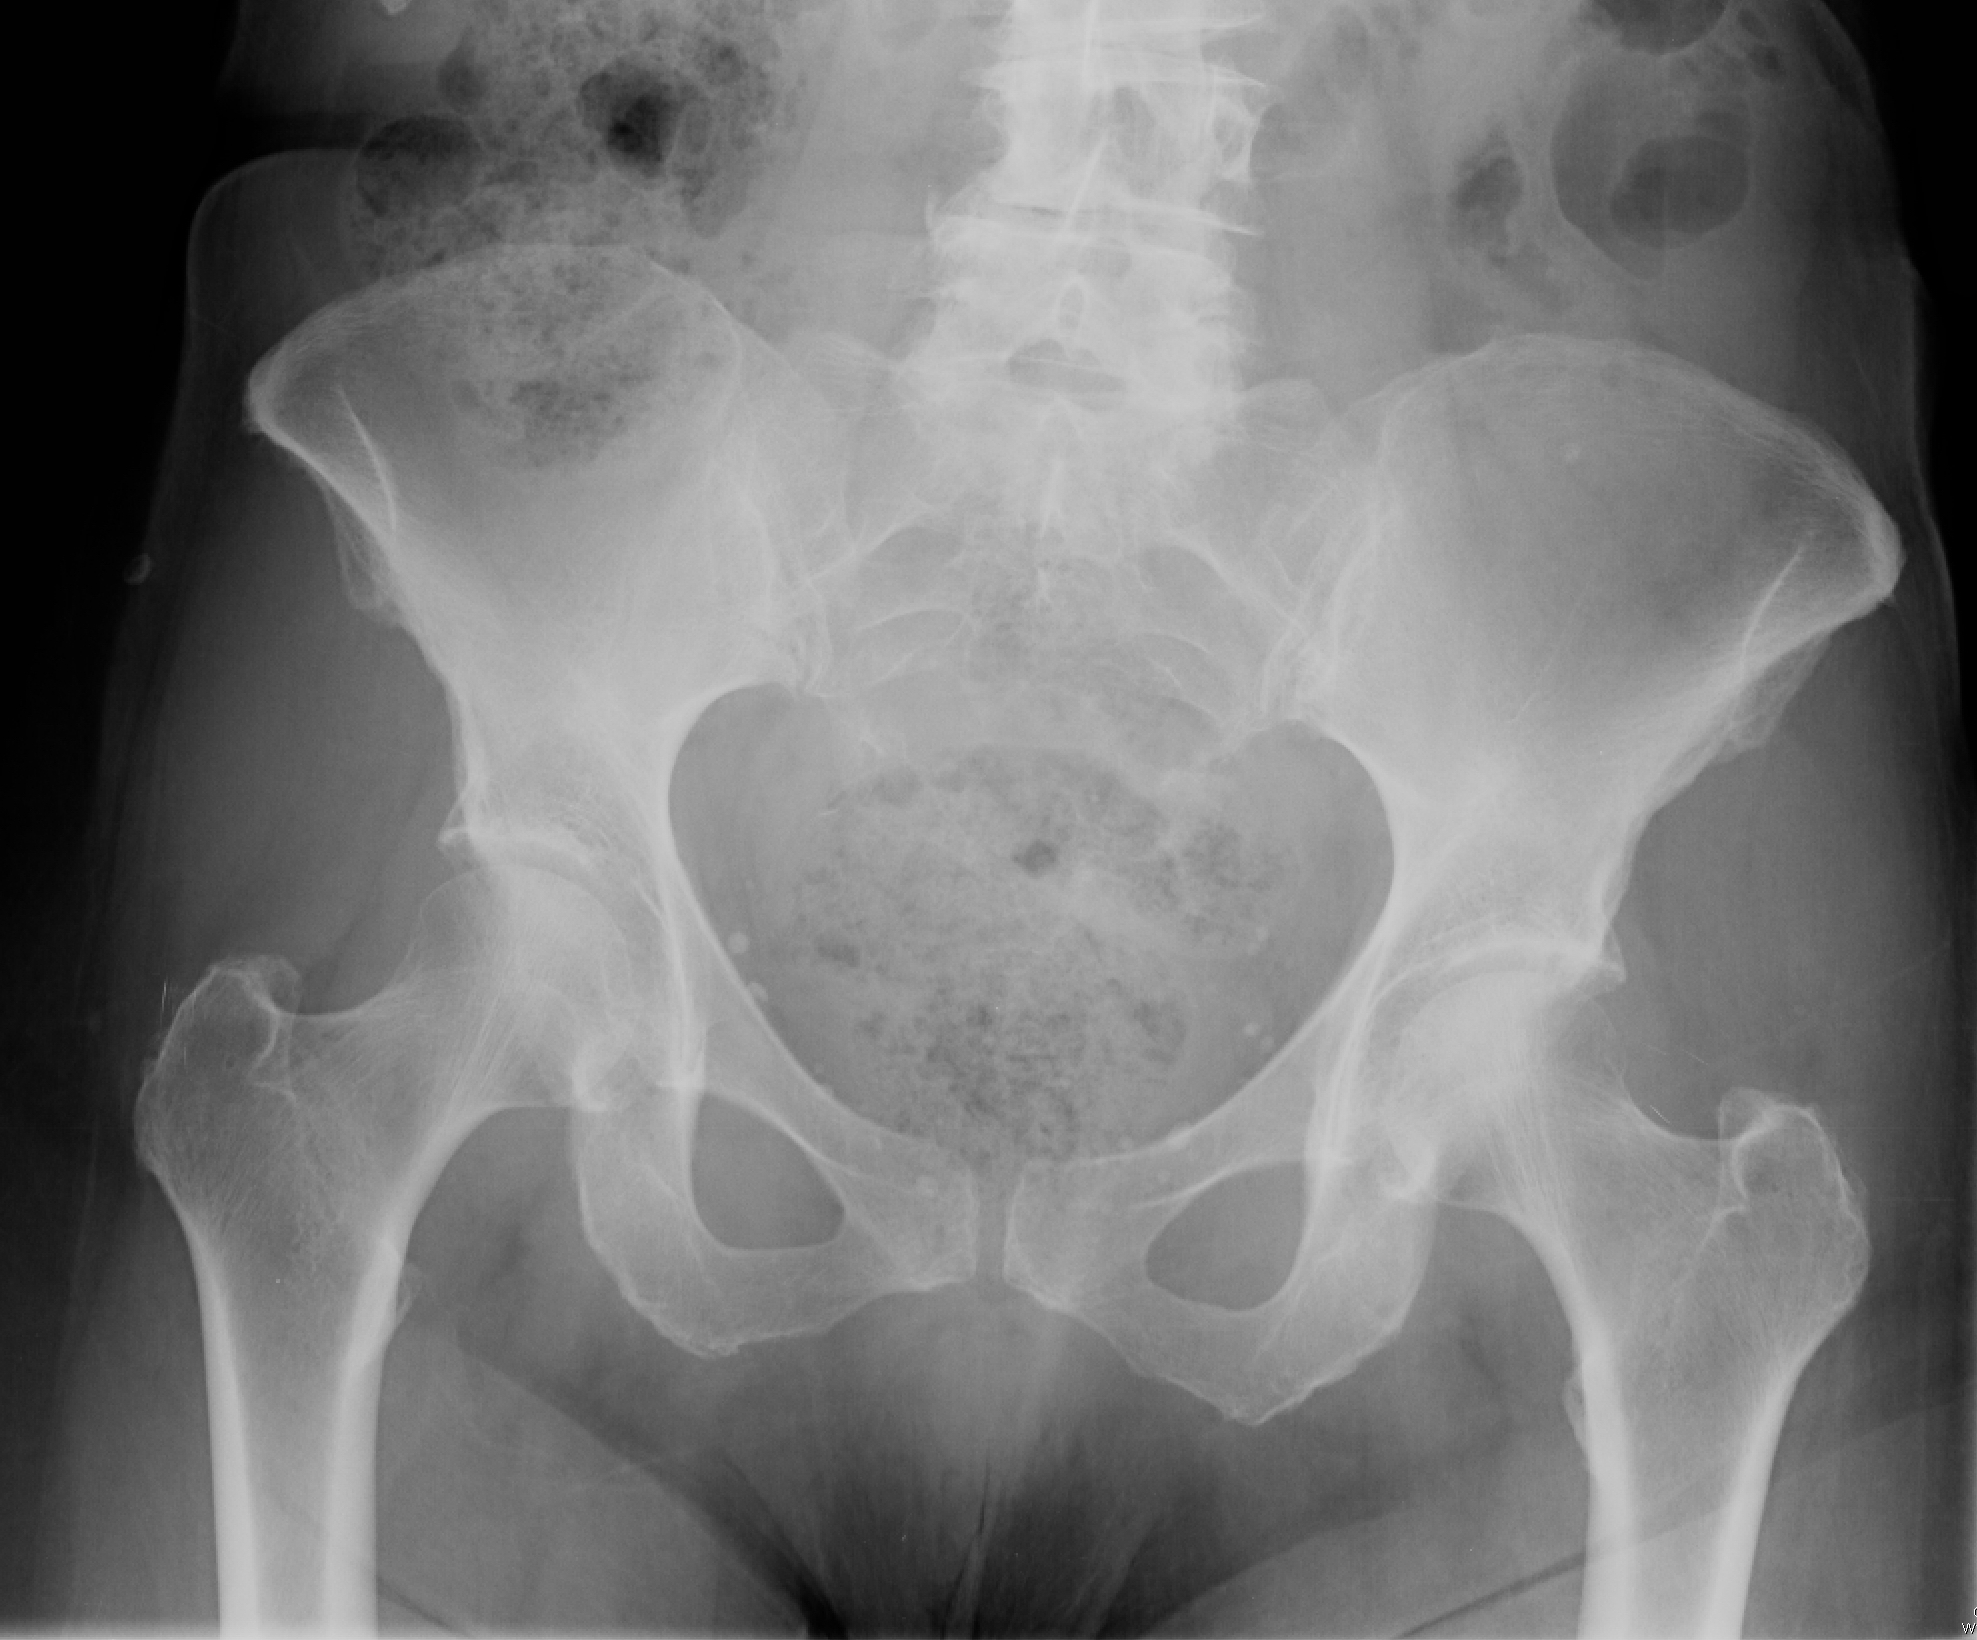
Fig. 1
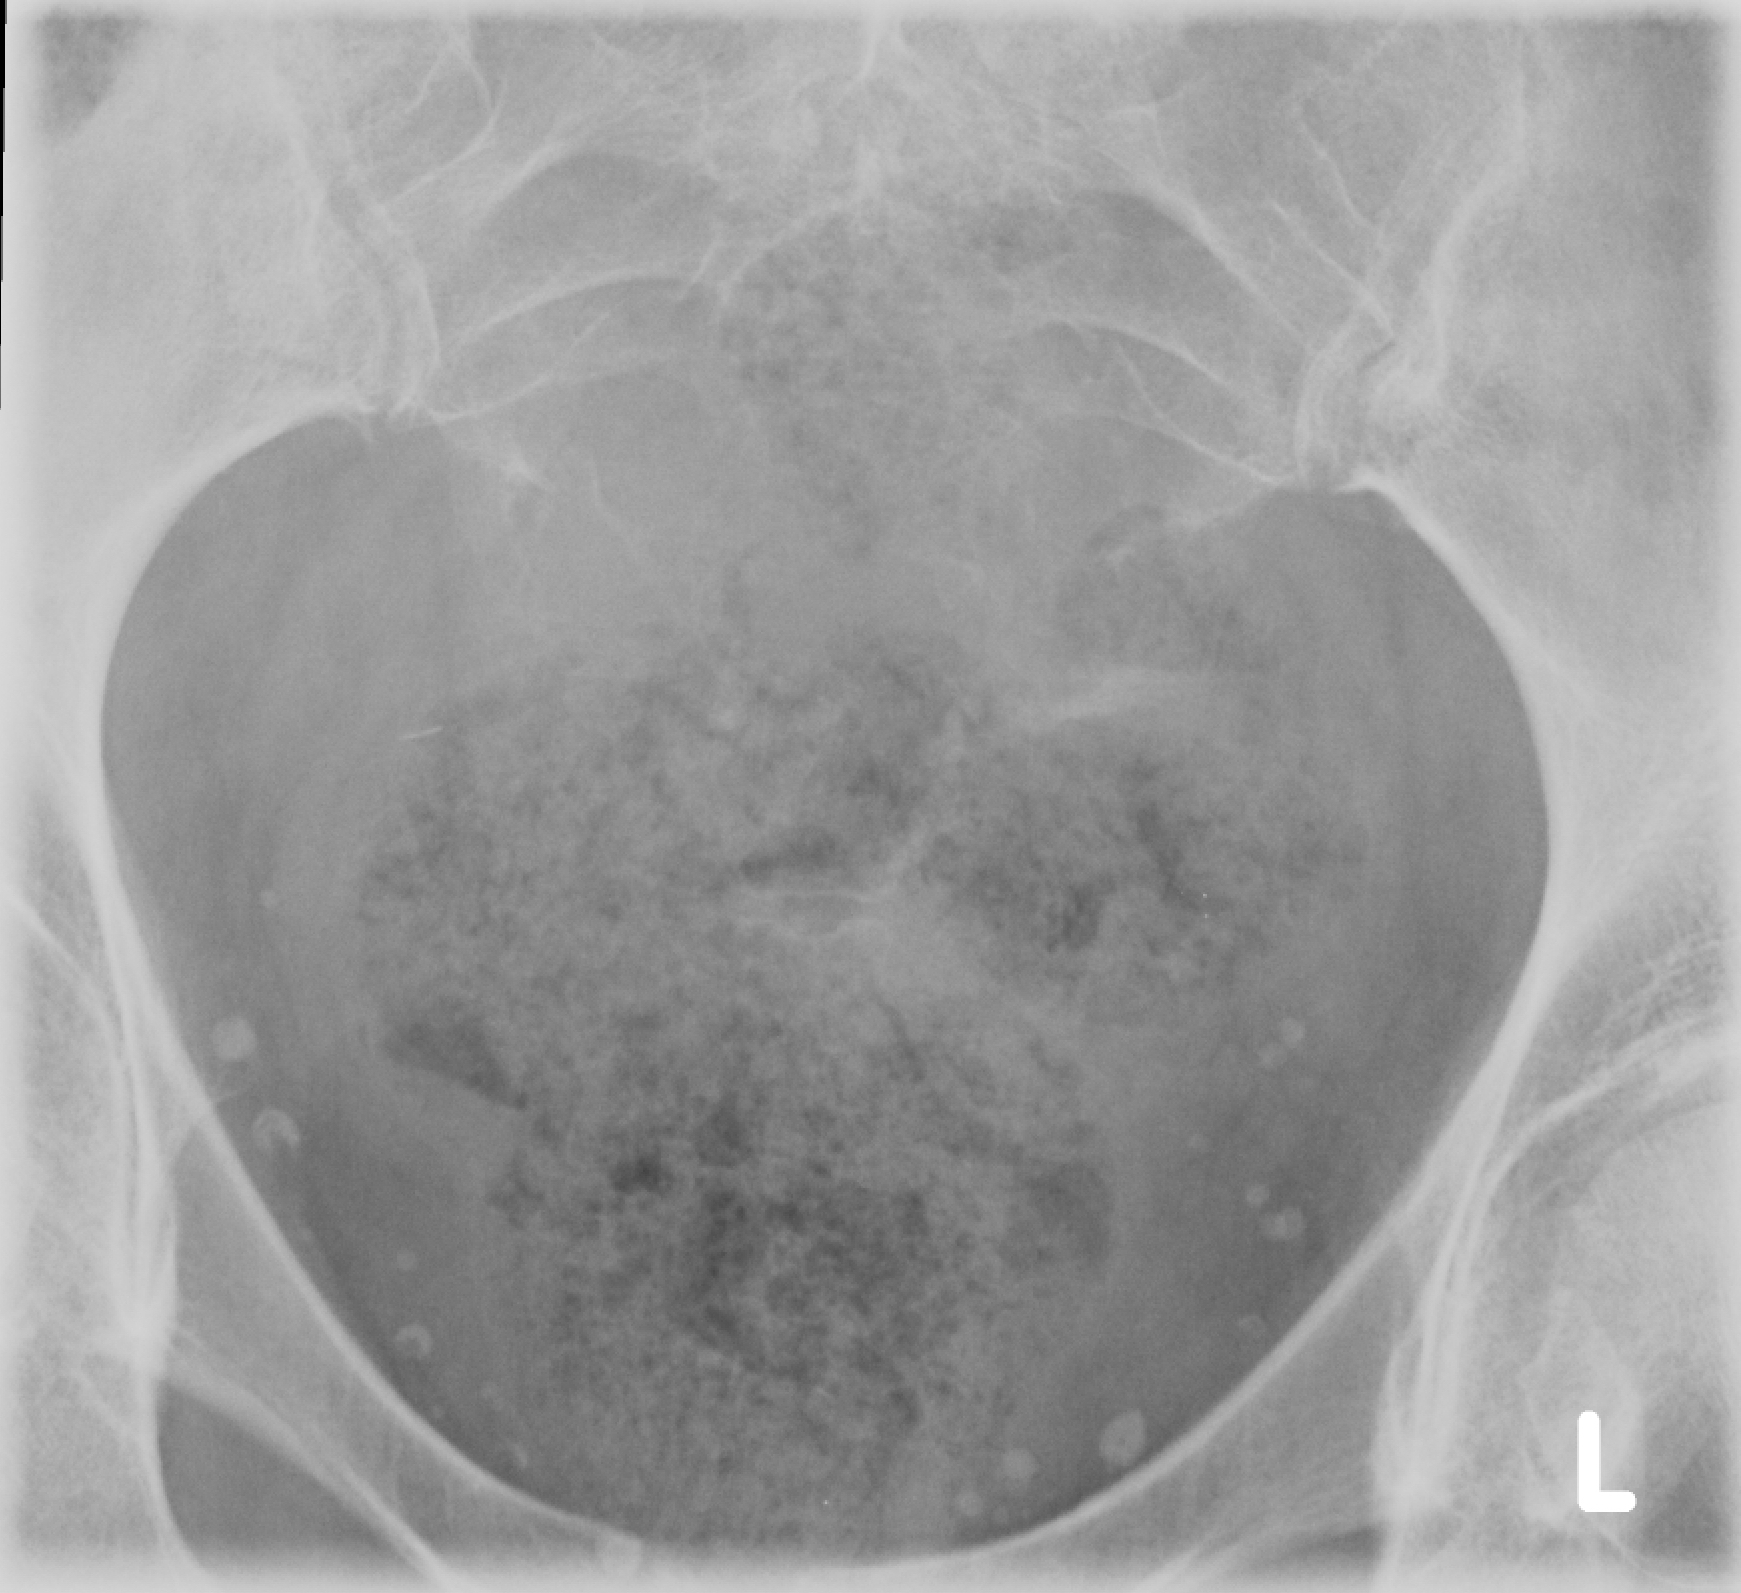
Fig. 2
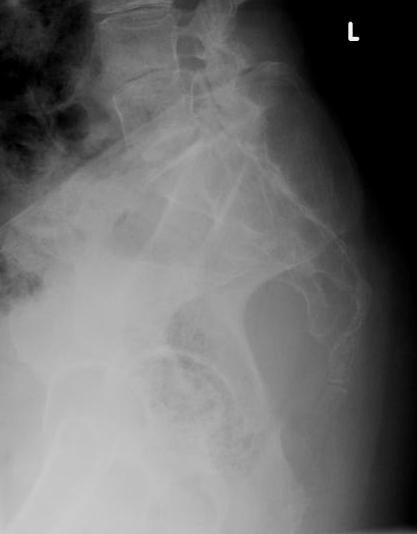
Fig. 3
Fig. 1-3: Plain X-ray of the sacrum demonstrates a chordoma. There is a lytic lesion of the sacrum with total destruction of the sacrum.
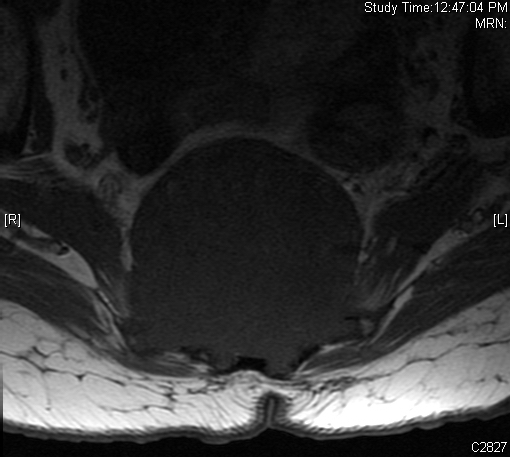
Fig. 4
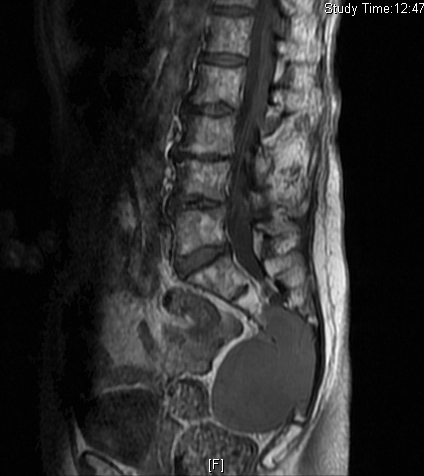
Fig. 5
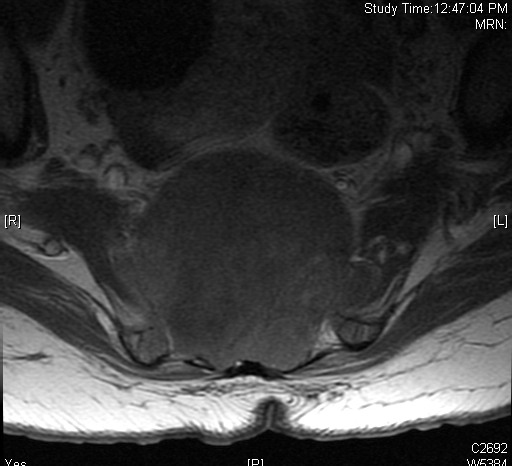
Fig. 6
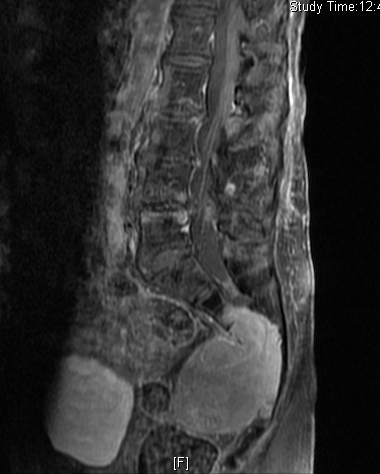
Fig. 7
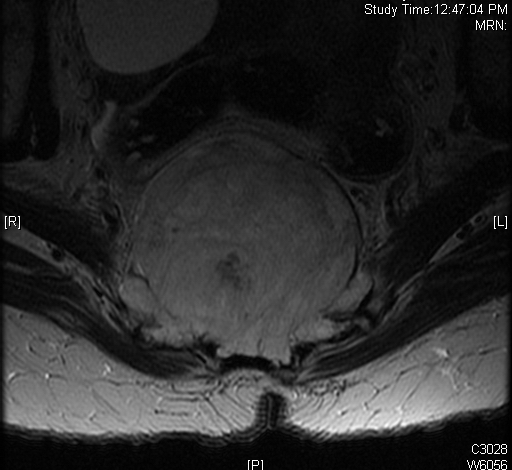
Fig. 8
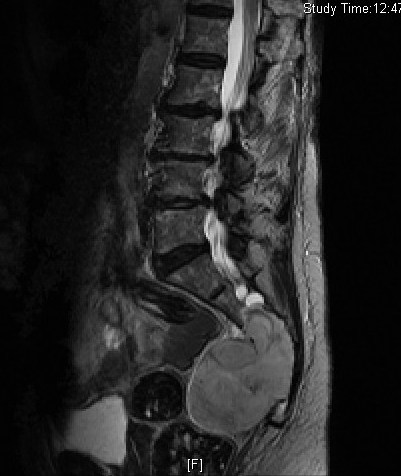
Fig. 9
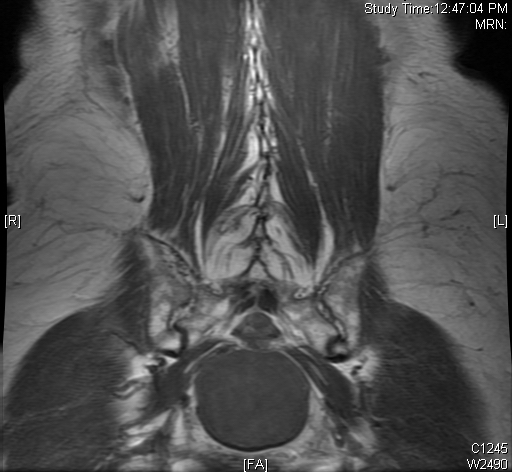
Fig. 10
Fig. 4-10: MR image of a chordoma shows a destructive bone lesion in the sacrum that is hypointense on T1W images, hyperintense signal on T2W and enhancement of the lesion after gadolinium.
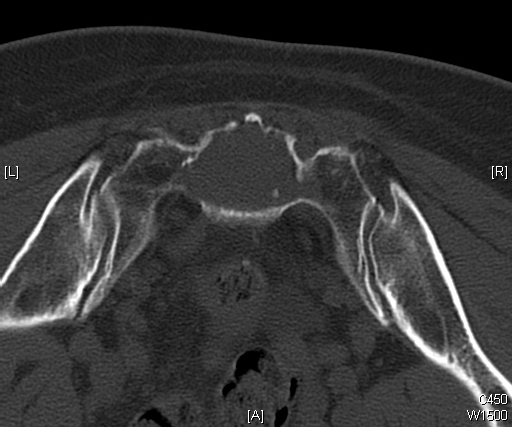
Fig. 11
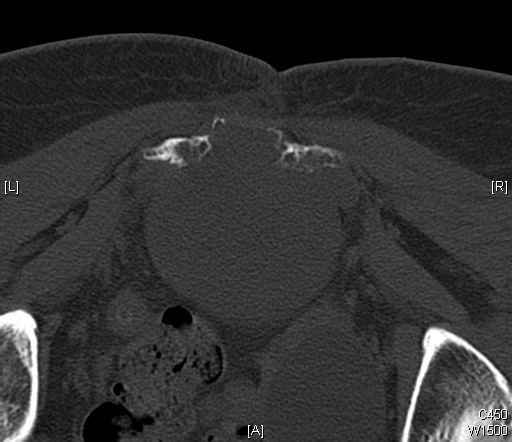
Fig. 12
Fig. 11 & 12: CT scan of a sacral chordoma demonstrates a lytic lesion of the sacrum with a soft tissue mass. Subtle calcifications in the axial CT scan.
PATHOLOGY
Gross
•
Generally from 5 to 15 cm
• Multilobulated, glistening
• Grayish to bluish-white
• Appearance similar to chondrosarcoma
• Despite extracortical extension, tumor may seem well-defined
• Soft tissue portion of lesion is covered by periosteal bone layer
Microscopic (Fig. 13 & 14)
•
Proliferation of large cells with eosinophilic cytoplasm with vacuoles (physalipherous cell)
• Nuclei are round/oval with prominent nucleolus
• Physalipherous cells are surrounded by myxoid matrix
• Lobules separated by fibrous septa
• Few nuclear polymorphism
• Few to no mitotic figures
• May exhibit cartilaginous differentiation
• Some show aggregates of microtubles in cytoplasm
• Chordomas coexpress S-100 protein (Fig. 15) and epithelial markers
• Tumors exhibit chromosome 21 abnormalities
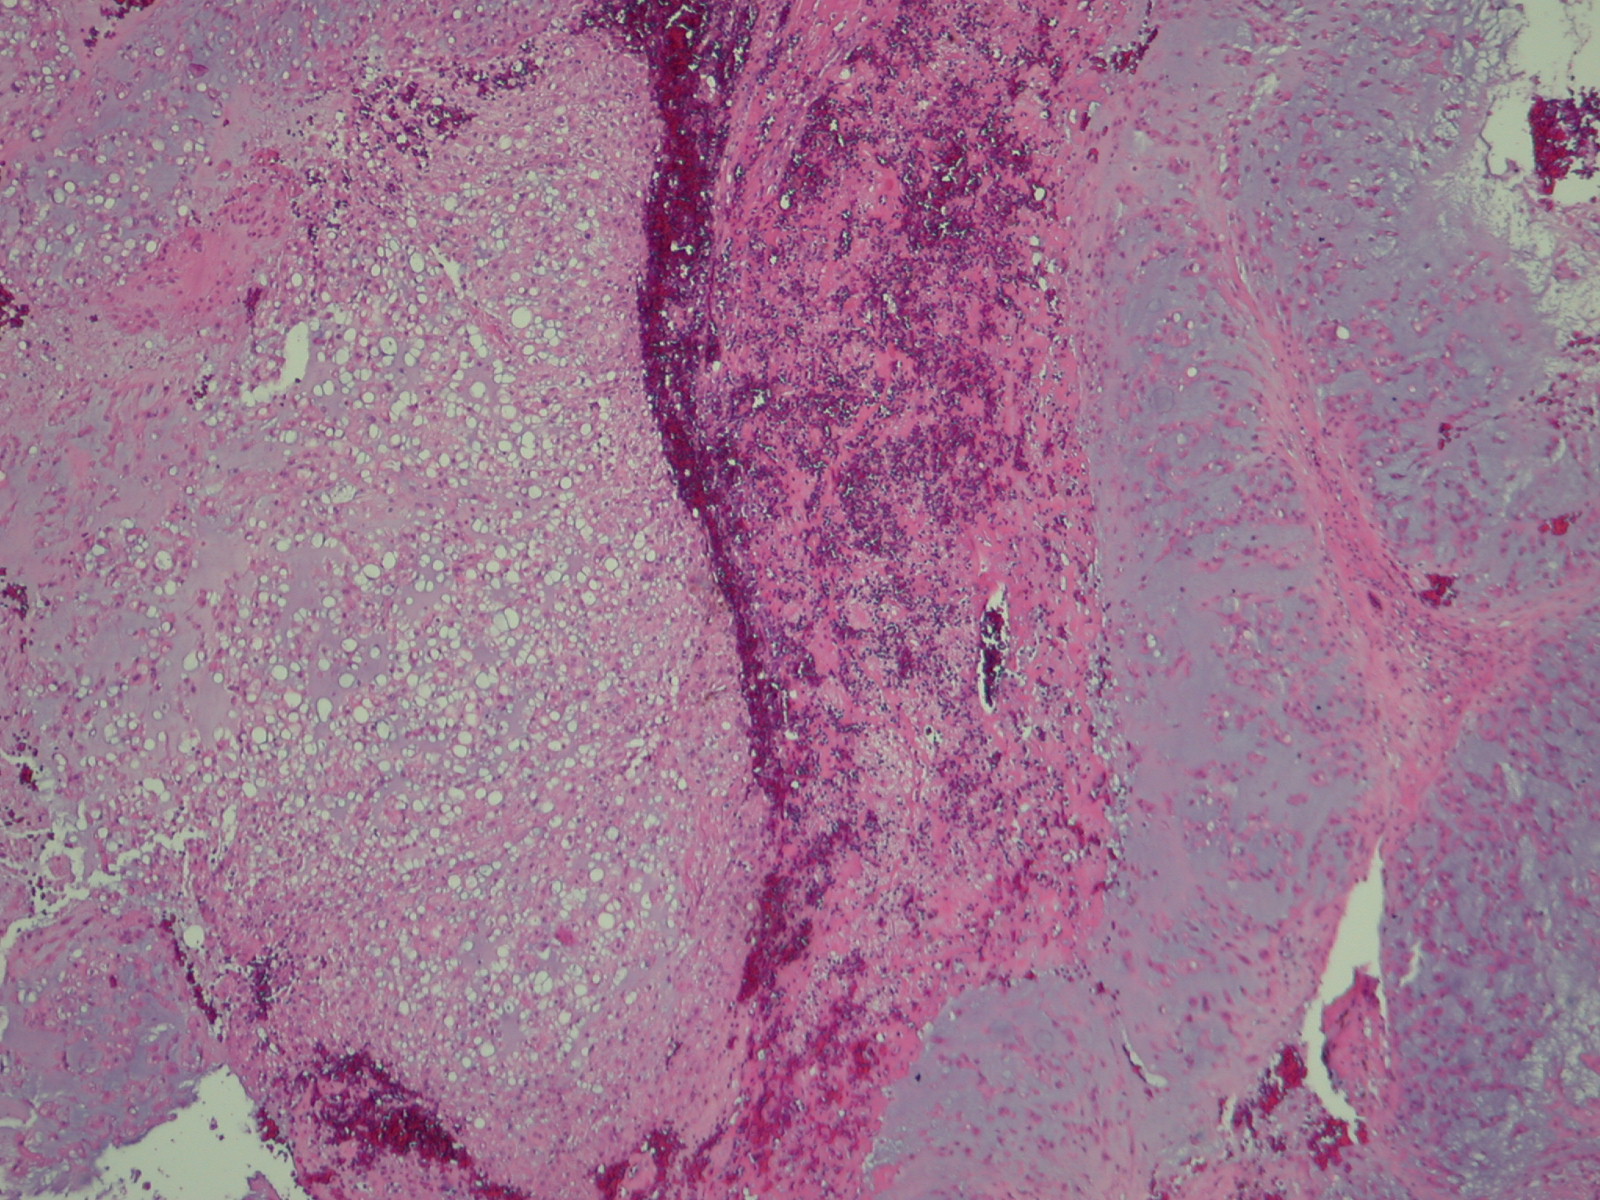
Fig. 13
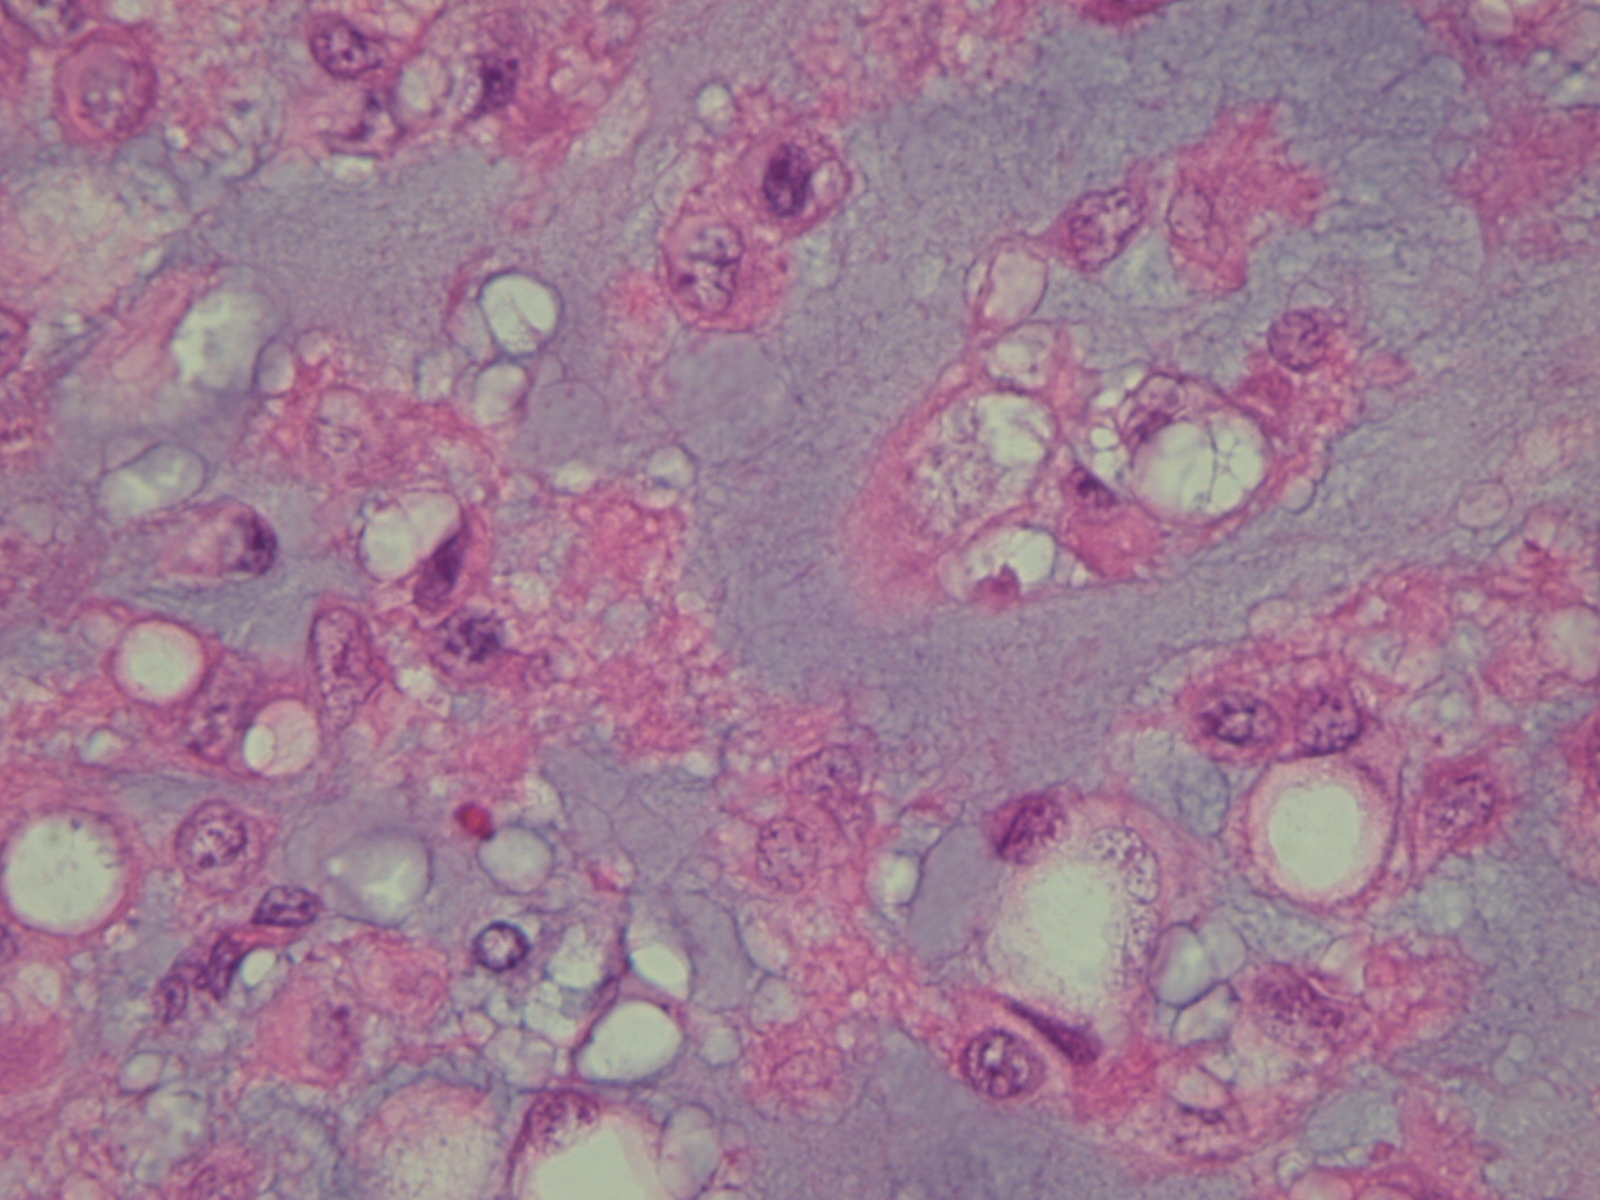
Fig. 14
Fig. 13 & 14: Microscopic pathology demonstrates hypercelularity forming lobules separated by fibrous septa. Higher magnification shows physaliferous cells that arelarge cells with bubbly cytoplasm surrounded by myxoid matrix. No mitotic figures are distinguished.
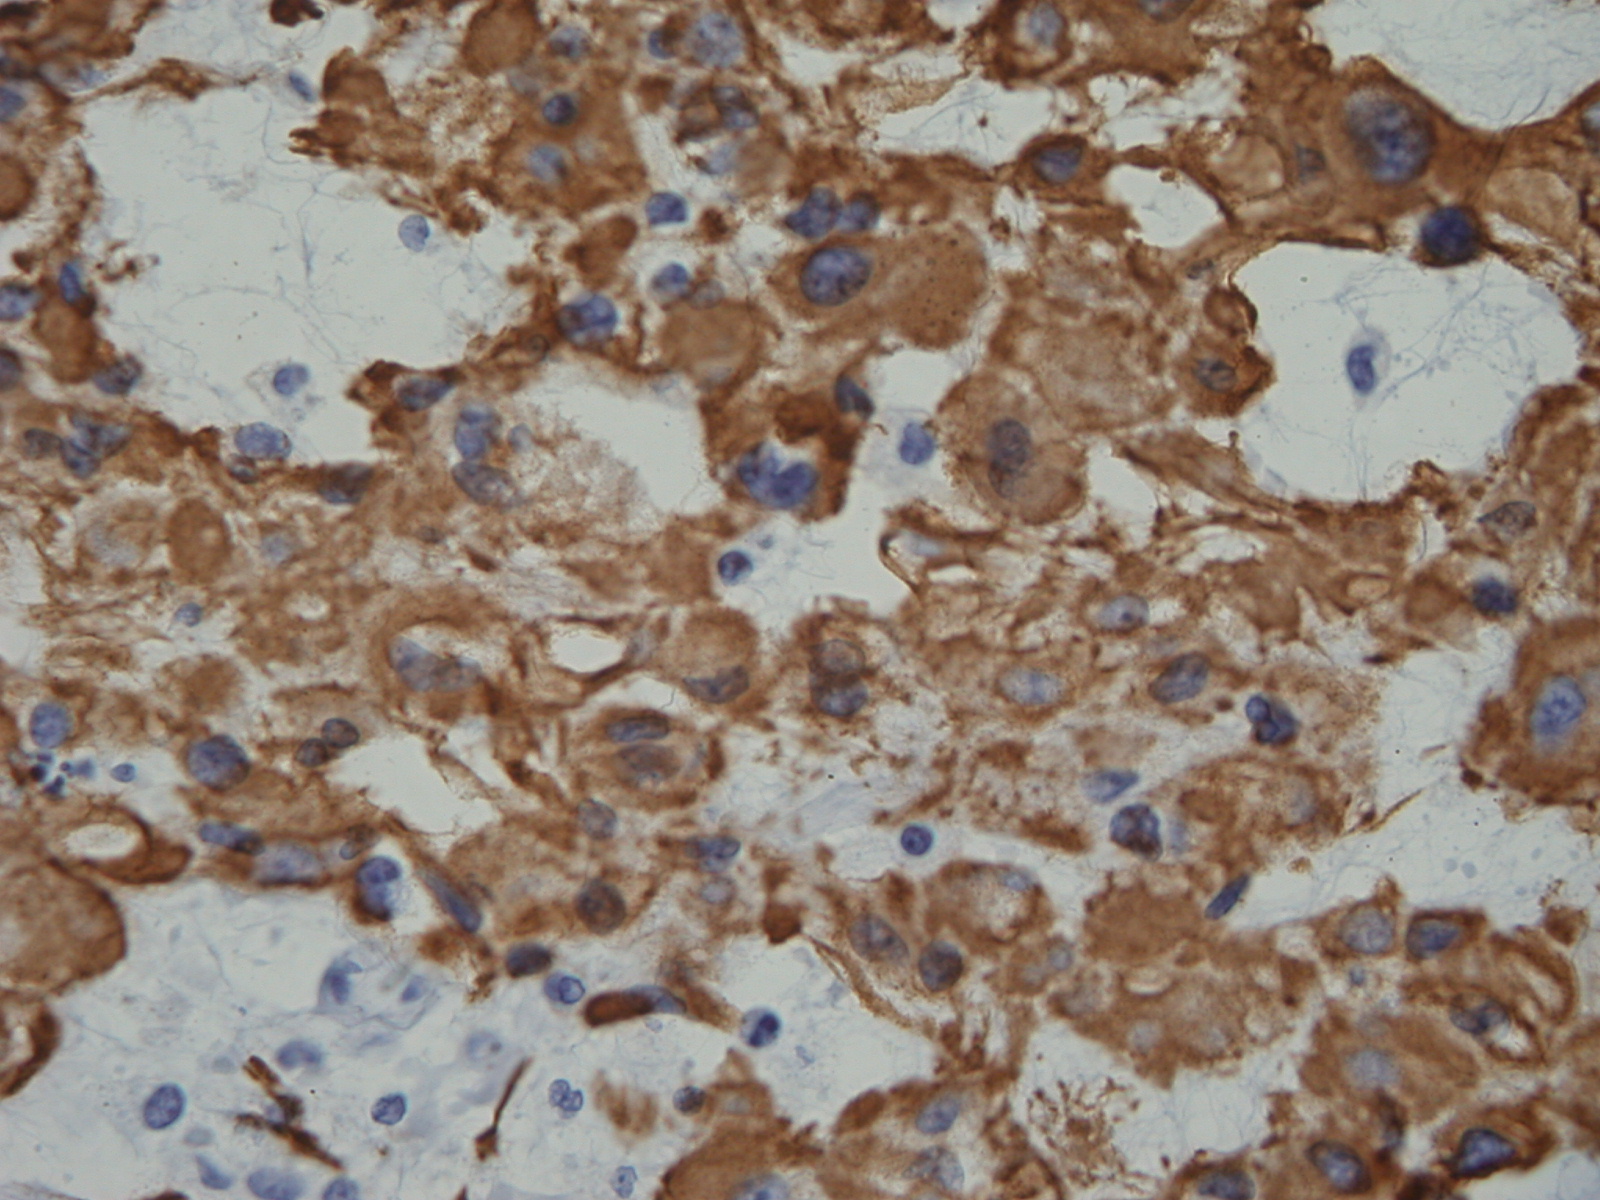
Fig. 15: Immunohistochemistry demonstrates s-100 positivity.
PROGNOSIS
Biological Behavior
• Locally aggressive tumor with high rate of local recurrence
• Due to its location on axial skeleton, vital structures may be affected causing death
• Local recurrences are common.
• Local recurrence is the most important predictor of mortality
• Extensive resection may be the most determining factor in affording an opportunity to cure.
• Lead to high/delayed mortality rate
• 65% rate of metastasis
• 5% of patient with chordomas show metastases at presentation; lung, bone, skin and brain.
• Mean survival rate is 4 years
TREATMENT
• Wide en-bloc surgical resection. Wider surgical margins improve the local recurrence rate.
• Notoriously recur even with a wide en bloc resection
• Enbloc surgical resection may be associated with a high degree of morbidity
• Extensive curettage and cryosurgery may be acceptable
• Total en-bloc resection is suitable in 50% of the cases.
• Radiotherapy still in debate when is used in conjunction with surgery.
• Cryosurgery shows optimistic results
• Chemotherapy is not effective
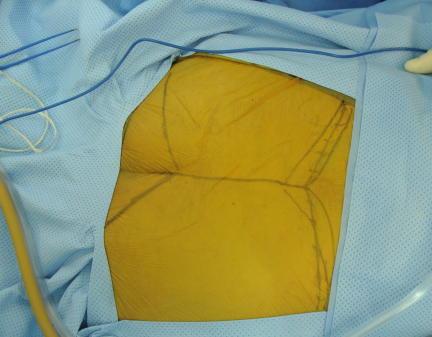
Fig. 16
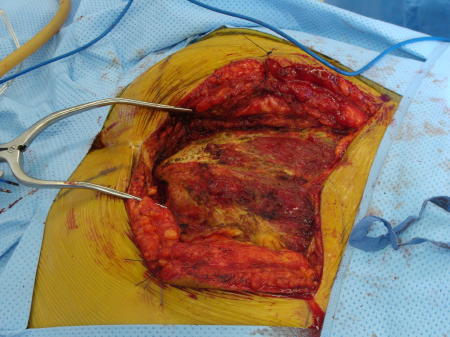
Fig. 17
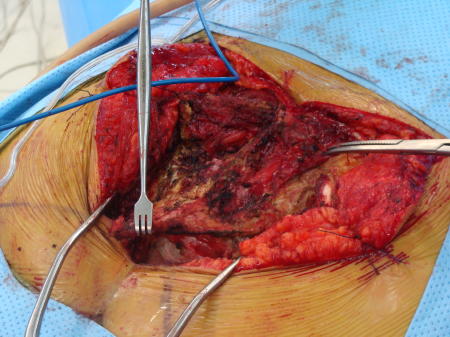
Fig. 18
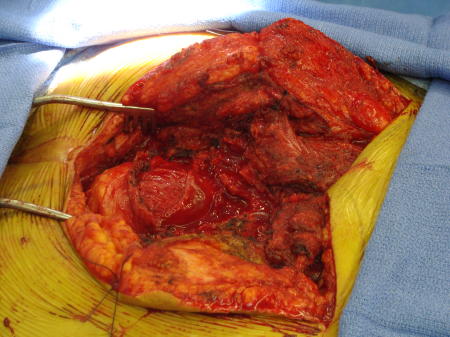
Fig. 19
Fig. 16-19: Intraoperative images show a posterior surgical approach of the sacrum with complete resection of the sacrum. This tumor was below S 3
